Saturday, 9 November 2019

SNP management of NHS Scotland

The SNP have decided to save the NHS across the UK, a cheap political stunt especially when considering the mismanagement of the Scottish NHS under the SNP.

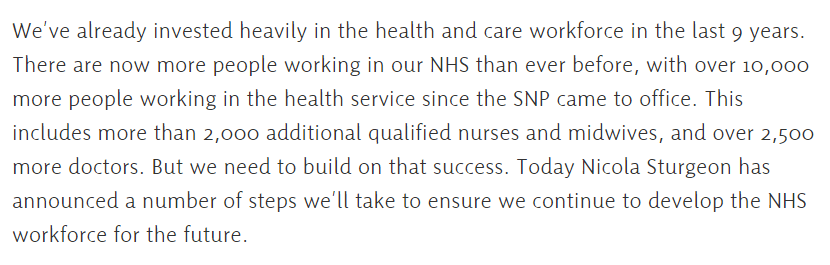
When asked about SNP NHS failings, the SNP will point to England NHS, a deflection tactic to avoid any real scrutiny of their failings.

The recent interview conducted by BBC's Nick Robinson sees SNP Ian Blackford squirm when quizzed on SNP failures on the NHS. Blackford thinks a patient satisfaction survey is all the evidence he needs to demonstrate how wonderful the SNP are at managing our NHS. What he doesn't mention  is how that figure is derived. There were over 4 million patients treated in Scotland in 2018, the number who completed the 'patient satisfaction survey' represented only 3.9% of patients treated that year.

Then we have nationalist supporters who think their own personal experience is all the evidence one needs to evaluate how well the SNP NHS is performing. This one was the chairman of a cancer charity which makes his comments even more abhorrent.


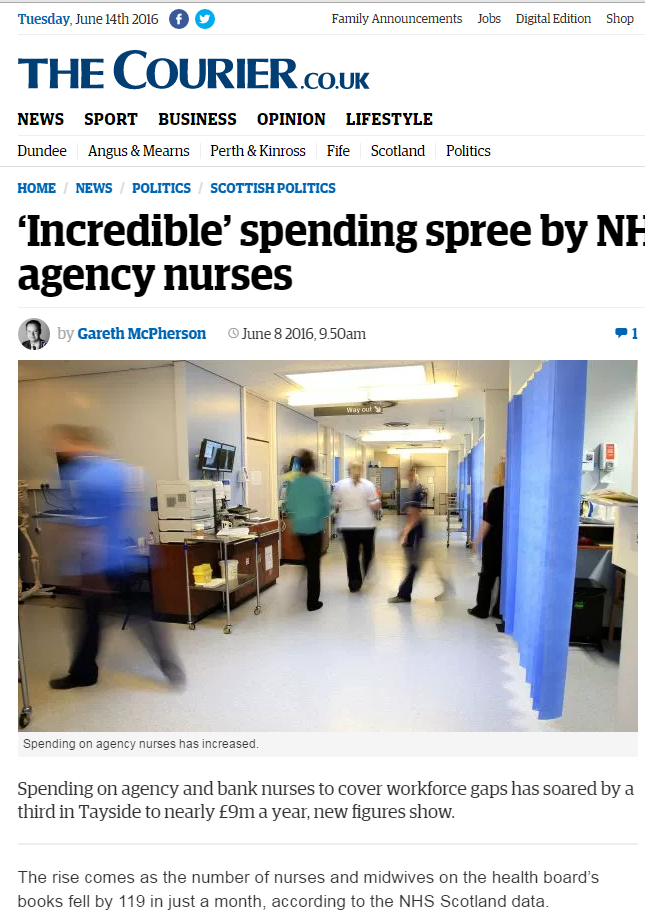
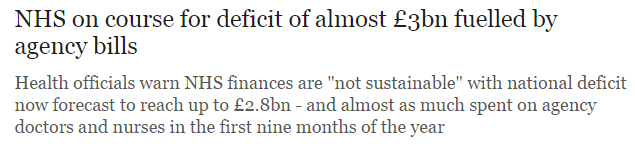
The recent Audit Scotland report shows our NHS is in crisis with a £1.8bn shortfall. The rate of SNP cuts to the health services has had a devastating result on health boards budgets. 


This squeeze on funding and the SNP mismanagement of our NHS is impacting on patient care/treatments/waiting times etc. Only 2 out of 8 key NHS waiting time targets were met in 2018/19.

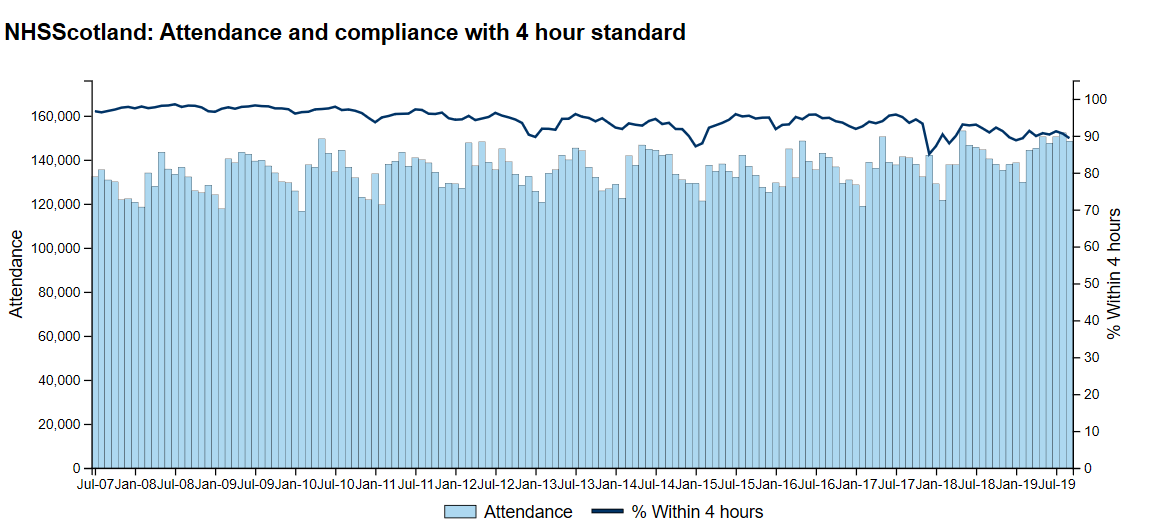
A&E targets were only met 3 times in the last 12 years.


The 18 week referral to treatment time pathway has not met its target since 2014.


The 95% target for those waiting for Outpatient appointments within 12 weeks has also been missed for years.


When it comes to something like cancer one would expect to be seen quickly, as we all know, time taken to treat cancer can be a matter of live or death. However, the SNP are failing on this critical target. The target has only been met 3 times in the last 3 years for the 31 day target and never for the 62 day target.

These graphs/figures are not just numbers they represent people who are suffering and perhaps even dying before they even get to see a specialist or get to start their treatment. 

These are just a few examples of SNP NHS failings, there are many more but don't be too despondent, the 'look what's happening over there' brigade has arrived to save us. Its people like this who refuse to accept any criticism of the SNP's management of the NHS that allows the SNP to get away with destroying our NHS.


Wednesday, 5 July 2017

NHS England Workforce

It's been a while since I looked at these figures, mainly due to the fact that I did not have any confidence in them and did not see the point in analysing dodgy stats*.  However this weeks headlines about the number of nurses working in NHS England made me curious enough to have another look to see if anything has changed.
I welcome NHS Digital's effort in cleaning up the data used to produce the statistics, however, there is still more work to be done.

As I've said in previous blogs, when analysing statistics its not just a case of looking at spreadsheets and adding/subtracting numbers, one must take into account methodology and data procurement to also understand the meaning behind the numbers.

So back to the NHS workforce statistics, is Jeremy Hunt and Theresa May right when they claim an extra 15,000 nurses in the NHS since 2010.  The honest answer is NO but to give a definitive figure is not possible due to data problems at source.

If I analyse the current statistics March 2017 and compare them with March 2010 (take note BBC factcheck, if comparing like for like then you should use 12 months stats not 14 months)
and do a simple subtraction then the number of hours nurses are working are up by 3911 FTEs.
However, its important that we do not look at these figures and think these figures represent actual number of staff working in the NHS, rather we have to remember that these figures are worked out in terms of hours worked by individuals not individuals themselves. So the total number of nurses working hours could be up by 3911 FTEs but it does not mean there are 3911 new/extra nurses.

The workforce figures are categorised into two sets: Whole Time Equivalent (WTE) and Full Time Equivalent (FTE). Thus, e.g. if I employed two members of staff working 60 hrs per week instead of the contracted 37.5 hrs then for FTE purposes I would have 3.2 people in my workforce,whereas I really have only two!  so you can see how this could inflate the actual workforce numbers and why there is so much confusion surrounding them.


Talking about inflating workforce numbers - I am not convinced NHS Digital have removed all private nurses from their stats. I do not see 30,000 drop in their nursing stats since it was discovered they were included in 2015. Nor are the bank nurses fully dropped from the data either.
The best indication of NHS workforce is looking at the datasets individual Trusts publish under their 'safestaffing' sections.


Thursday, 1 December 2016

Scotland's Education

The UK parliament issues a report yesterday'Demography of Scotland and the implications for devolution', copy of which is here
It is a sobering read, it highlights many challenges including our ageing population and lower life expectancy - as demonstrated in the report


A substantial part of the report focused in on Scotland's economic sustainability and growth, in particular the need for migration and ensuring that Scotland has a highly trained/skilled workforce in order to grow business and attract investment.

I was shocked to see SNP's Pete Wishart MP tweet in relation to the report


Err - is he really asking that question? shouldn't the Scottish Government have all the answers and a plan that has seen them implementing strategies over the past 9 years they've been in office? -
It would appear not so let me try and point Mr Wishart on what not to do ....

Firstly there is the appalling attainment gap in our primary schools here -

only now have the SNP put a plan together to address it, time will tell whither that strategy will succeed but we are looking at another generation of kids that will fail to achieve.

Then there is high school performance league tables here, which, similar to the primary school tables, shows a clear class divide between the rich and poor, with many schools struggling to get their pupils 5 highers or more which is the amount required for most university places.

Moving up to further education we have seen unprecedented cuts in our colleges here.

I hear students being unable to complete their two year course as they have been kicked off it after one year by the college so that they can offer the place to school leavers in order to ensure youth unemployment figures remain low, thus they are unable to complete their training and gain their certificates.

Last but not least are our Universities.  We have some of the best Universities in the world and rightly they attract a lot of interest from international students. However the number of places for Scots kids are falling as reported here


Free higher education is still available in Scotland.  The Scottish Government however prefer to extend the gift of free University tuition to our European rather than rUK neighbours in the hope it would stimulate migration into the country, the subject of which is mentioned in the report here


Given that it costs c. £93m p.a. to provide free higher education to EU domiciles, one would expect the Scottish Government to show the tax payer a return on their investment, however, as demonstrated in the graph, most come to Scotland to study and leave after graduation and there is little 'pay back' for the tax payer.

In order to get official statistics into University outcomes I sent FOIs to the Higher Education Statistics Agency (HESA), details of which is here (when it came to providing me with the statistical tables HESA preferred to email it to me instead of making it public) and also to the Students Awards Agency for Scotland, details here.

I asked the HESA for all students who receive free university places in all subjects and also extract EU domiciled specific data. I also asked them to break down the stats to give me those who are studying medicine as we have a shortage of doctors in this country as featured in the BMA here


I was interested in knowing how many medical students stayed in Scotland after graduation.  The figures are shocking and would explain why there is a shortage of doctors.


The HESA tables are quite complicated and needed amalgamating in order to get the full picture.

The HESA data shows a huge increase in the number of EU students from 15,930 in 2009/10 to 20,805 in 2014/15. Not all students qualified and in years 2009-2015 the average pass rate was 35%. The average number of students who stayed and worked in Scotland after finishing University was 3.67%.

The figures detailing our medical schools show that very few EU domiciles stayed to work in Scotland after graduating but it also shows the same applies to Scottish/rUK students.

The results of the amalgamated tables:


Data from the Students Awards Agency for Scotland show that EU domiciled students did not require students loans, which suggests its EU middle classes taking advantage of free tuition.


Is it really too difficult for Pete Wishart and his colleagues to join the dots and see where they've went wrong?  It would appear so and I see no evidence that there are coherent plans to put it right.


Tuesday, 14 June 2016

NHS Scotland Nursing Figures

This post is an update on the NHS Workforce blog published in February.

At First Minister's Questions on the 9th June, Nicola Sturgeon reiterated that the SNP have increased nursing staff by 6% since coming to power; this would gives nursing statistics an increase of over 2000 nursing staff.  One would be forgiven if they interpreted this as our NHS having 2000 qualified nurses working in our wards and our community, as stated by Health secretary Shona Robison. Unfortunately it does not.  I decided to have a closer look at the nursing statistics and raised some questions with ISD, Scotland's equivalent to HSCIC, both organisations responsible for collating, analysing and publishing the statistics relating to the NHS.

I first asked ISD if they could confirm that Nicola Sturgeon was correct in her statement to parliament that there was an increase of 6% - the response was that it was correct


So it looks from this Sturgeon was correct and everything in hunky-dory
however...something's not right; this does not marry up with news headlines


and this


I wanted to look closer at the 43,418 figure. Forget the 29 interns - they are not qualified, so now we are down to 43,388 "qualified nurses".

ISD sent me the sub tables for nurse/midwifes workforce to examine


The sub tables have drop down menus that allow one to search by categories


The five categories are:


  • Hospital
  • Community
  • Hospital/Community Combined
  • Prison (Clinical staff came over to NHS control in 2013)
  • Other/Non applicable


Hospital

In this section I found there was an increase in qualified nurses/midwifes; and increase of  255 since 2011 (sub tables only went back to 2011)


Community 


In this section I found an increase of 401


Hospital/Community Combined

This section showed a decrease of 945


Prison 

This showed 196 nursing staff moved over to NHS


Other/Non applicable

This is a strange category and one I had to seek clarity from ISD as to its meaning


It was indeed very helpful! So office staff are included in the nursing figures as their pay in under Agenda for Change Pay Rates


This category shows the biggest increase over the years from 935 in 2011 to 2374 in 2016 - an increase of 1439


Oh dear and I thought the Tories were bad at using dodgy stats!

If we add up all the figures it shows 'real' qualified nurses/midwifes working in our NHS Scotland is 41,013 - lower than 2006 figures!


I shall be sending my findings to the Scottish Parliament - watch this space.


Monday, 25 April 2016

NHS workforce - It ain't rocket science

A stockbroker once said to me "the key to successful stockbroking is not looking at the companies financials/forecasts/market but rather its looking at these in conjunction with whats happening in our world through media reports, this influences the stock market more than individual company performance- it ain't rocket science".

He was demonstrating that statistics on their own are meaningless and in order to gauge the true picture one has to look at external influences and supporting evidence.

A case in point is the NHS workforce, if we are to believe the 'official' statistics, we now have record number of nurses in our NHS - so press headlines would reflect that ...

"Ward accidents increase as nurses falling over each other" 

"Patients complaining that they can't rest as too many nurses caring for them"

said no newspaper ever


Joking aside - we are told we have an increased nursing workforce add to that the huge number of bed closures and add those two together would give us a greater nurse to patient ratio.

BUT if the latter is correct then we would not have headlines like this .... National Health Executive


or this ... The Mirror 


and we certainly wouldn't be seeing the need for this ... The Telegraph 


All external evidence suggests that the government statistics are wrong  ... and they are


but you don't need a degree in mathematics to know when the government is lying about numbers; all you need to do is see if external reports support their statistics.


Thursday, 10 March 2016

NHS Scotland Workforce - What the SNP are not telling us

To much fanfare the SNP announced that there are more people working in our NHS Scotland than ever before as stated here  and from Shona Robison (Health Minister) here but the headlines are misleading and some of the claims are false.


Claim 1 - There are more working in our NHS than ever before, with over 10,000 more people


Claim 1 = False 
There are actually 6,633 more people working in the NHS but this figure also include those Health Care Professionals who are working in our prison service,agency nursing and a category classed as 'not assimilated/unknown'.
There are no figures for the amount of HCPs working in prisons so I cant subtract the number from the overall totals but I was able to subtract agency nurses.


Claim 2 - The are over 2,000 additional qualified nurses and midwives


Claim 2 = False 
If we added all staff that are on bands 1-9 then there are an additional 1,873 staff, still nowhere near the "over 2,000" claim. However if we take the actual number of "qualified nurses and midwifes" the total amount comes to 960 , however 70 of these are 'unknown' banding and therefore the figures could be lower if those 70 are >band 5.  I have no idea where the misleading "over 2,000" figure comes from; perhaps the SNP did a 'Lintern' and added the last three months of 2015 to hike up the totals instead of taking the figures from September of each year??


Claim 3 - There are over 2,500 more doctors


Claim 3 = False 
Keeping in mind that GPs are not included in ISD 'overall workforce stats' as they are not NHS 'employees' and therefore not on the HR system, then the total amount of additional doctors is 1,989.

I guess we should be thankful that at least there is an increase rather than a decrease but given that our ageing population has increased by 17% and due to rise to 25% over the coming years there is simply not enough staff or indeed the right kind of specialist staff to cope; under the SNP government we have seen decreases in specialised areas e.g.:

Acute                       140 nurses
Geriatric doctors     12.4%
Oncology                10.1%
Orthopedics            7.7%

So there you go folks, the SNP can spin NHS stats just as much as the Tories can.


Tuesday, 9 December 2014

NHS Nursing - The brain drain

I was hoping that I could leave this topic behind given that the statistics provided by HSCIC are, I believe, unreliable as identified in my previous blogs here and here.  It goes against my all my training to analysis figures I have no confidence in but given Saturdays article in the Mirror and viewing several twitter conversations on the topic:


After seeing this I decided another article was necessary. The problem with the Mirror's figures is that they made the same mistakes as Shaun Lintern as described here, essentially they do not take year by year comparative figures, quoting May 2010 figures and comparing them to August 2014 figures distort the figures.  However the general premise of the Mirror article is correct.

First of all I want to look at the Acute, Elderly and General Nursing


I have removed 1st level nursing from this graph as its difficult to plot while allowing you to see the trends for the minority, but highly skilled nurses, as will be demonstrated later.

This graph shows that the total number of nurses in these categories have decreased.

Modern Matron 
August 2010 /11 = 35,418
August 2011/12 = 33,031 down 2,387
August 2012/13 = 31,320 down 1,711
August 2013/14 = 30,498 down 822
Ending August 2014 with a decrease of 4,920 from 2010

Managers
August 2010 /11 = 43,019
August 2011/12 = 30,031 down 12,988
August 2012/13 = 39,518 up 9,487
August 2013/14 = 42,248 up 2,730
Ending August 2014 with a decrease of 771 from 2010

Children's Nurse
August 2010/11 = 4,325
August 2011/12 = 7840 up 3,515
August 2012/13 = 3,335 down 4,505
August 2013/14 = 3,438 up 103
Ending August 2014 with a decrease of 887 from 2010

Other 2nd Level > Bands 6-8
August 2010/11 = 28,069
August 2011/12 = 24,408 down 3,661
August 2012/13 = 23,525 down 883
August 2013/14 = 19,851 down 3,674
Ending August 2014 with a decrease of 8,218 from 2010

Which gives a total decrease of senior nurses by 14,796 since 2010

Looking at Level 1 nurses - now we know from HSCIC that these also include bands below band 5 (qualified nurse) and therefore this is an area of contention for me as not all in this category are qualified nurses. However when I put these into the graph it is plain to see that the Mirror's article is highlighting the problems this creates as "senior nurses play a vital role in patients safety". Don't think many would disagree with Andy Burnham when he states “Nurse losses on this scale risk threatening standards of patient care. Half of nurses say their ward is dangerously understaffed as hospitals shed ­experienced nurses in a crude attempt to save money".


You can see quite clearly that the lower nursing grades overshadow the more qualified nursing grades. There is only 1 senior nurse (2nd Level) to every 78 junior nurses (1st Level).

In other disciplines we see a similar pattern with more staff losses:

Maternity

The total decrease of these categories from 2010-2014 is 3328

Paediatrics


The total decrease of these categories from 2010-2014 is 378


Other Psychiatry


The total decrease of these categories from 2010-2014 is 2982

Community Psychiatry lost a total of 690 nurses between 2010-2014


I have no idea where the Mirror got its figures from; "Britain’s total nursing staff plummeted alarmingly from 280,765 in June to 278,924 in August, according to the ­latest official figures"
According to the HSCIC there were 313,752 nurses in June compared with 311,670 in August so the total number of nurses lost in that period is 2,082. 

So the points made by the Mirror and Andy Burnham are valid.  Jeremy Hunt claims that the article is misleading and that the number of nurses falling is due to "seasonal variation" and that there is always a temporary dip in the summer months.  It appears that the "summer months" in England start in April.


Dont you just love politicians.